Microsoft PowerPoint Making Diagrams (Mac)
PowerPoint can be used to create diagrams that you may use in Word as well as PowerPoint.
The tools for drawing in PowerPoint can be used to create these common kind of diagrams:
- Venn Diagrams--see here for a discussion of the uses of Venn Diagrams.
- Flowcharts --see here for a discussion of the uses of Flowcharts.
- Concept maps-- see here for a discussion of the uses of Concept maps
- Or any sort of drawing or structure that requires text and lines or arrows, such as syntax trees, circuits, PERT, fish-bone or cause-&-effect diagrams, blueprints, and lots more.
PowerPoint drawing tools features the standard objects and conventions of Unified Modeling Language (UML) to specify, visualize, modify, construct and document the artifacts of an object-oriented software intensive system under development.
See here for a complete list of diagrams that you might do with PowerPoint.
Start with a Blank Slide
The best way to create a drawing is to use a blank slide.
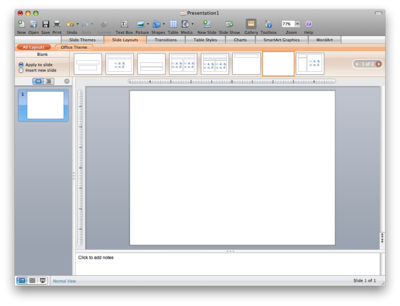
You can create a blank canvas by opening the Slide Layouts Gallery and selecting a blank slide.
If you have started from a new presentation (with a title slide as the default), it will convert the current slide to a blank one.
The blank slide is like a canvas for drawing.
It is laid out as a printable page of 8 1/2 x 11 inches, in a landscape or wide view. You can change the size of the "canvas" by changing the size of the slide layout.
But for most of your diagrams this default size should work well.
Basic Tools in PowerPoint
This is a part of the main tool bar.
This icon triggers your "selection" tool -- a cross-hair to capture the item you want to edit or move.
- This icon triggers a tool to create a "textbox" for typing.
- This icon is for either images (on the computer as files like photos) or "clipart" which is part of Microsoft Office Clip Gallery.
- This row of icons includes one for Lines, one for Squares, then a collection of shapes, and then a collection of lines and arrows and connectors.
Tips and Tricks on Using Drawing Tools
- To make a perfect square or perfect circle, hold down the SHIFT key as you draw the object.
- To make a straight line, hold down the SHIFT key as you draw the line (up-down or sideways).
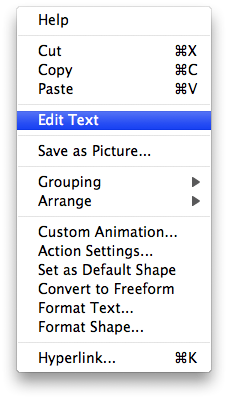
- Select the object you wish to edit. Then use the Right-Mouse Menu to select formatting options and to enter the text editor.
- See the full menu to the right: it includes many options for drawn objects: Editing Text in an object, Grouping, Arranging the layers of them (putting one on top of another, for example), Saving as a Picture, and more....
Using the SmartArt Graphics Gallery
PowerPoint has special tools for creating certain types of diagrams, such as Venn Diagrams, Flowcharts, process drawings, hierarchies and so on.
To access these tools, click on SmartArt tab on the toolbar.
To Make a Simple Venn Diagram Using SmartArt Graphics
After clicking on SmartArt on the toolbar, select Relationship section.
Those are some of the different types of diagrams.
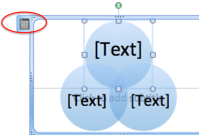
To edit what the diagram is saying you can either click on the [Text] or you can click on the black box in the upper left corner.
- The green plus will add another circle/add more bullet points
- The red minus will delete a circle/delete bullet points
- Blue arrows will move the bullet points in the circles
- Green arrows will change the circle position
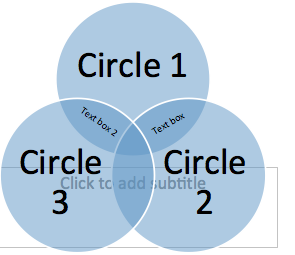
You can add text boxes where you want to add other dialog
To Make a Flowchart Using SmartArt Graphics
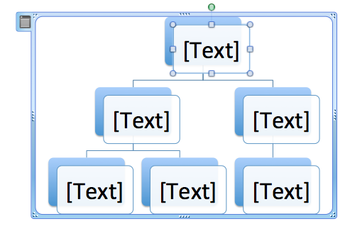
After clicking on SmartArt on the toolbar, select Hierarchy section.
To edit what the diagram is saying you can either click on the [Text] or you can click on the black box in the upper left corner.
- The green plus will add another box
- The red minus will delete a box
- Blue arrows will move level the boxes are at
- Green arrows will change the box position
To Make a Concept Map Using SmartArt Graphics
After clicking on SmartArt on the toolbar, select Cycle section.
To edit what the diagram is saying you can either click on the [Text] or you can click on the black box in the upper left corner.
- The green plus will add another box
- The red minus will delete a box
- Blue arrows will move level the boxes are at
- Green arrows will change the box position
Our Internal Help Pages for Audacity Include
Other Resources
For help from Microsoft: Click Here!
